العمل الإجرائي لرسم القلب
- صور رسم القلب
كل قطب كهربي موصل بالجسم يعتبر كاميرا و نقوم بوضع 10 اقطاب علي جسم الانسان واحد على كل
ذراع وكل ساق وعند ستّ نقاط على الصدر و بالتالي نحصل علي 10 أقطاب ( كاميرات ) من جهات مختلفة ، كل كاميرا تنتج لنا صورة مختلفة عن الكاميرا الاخري لان كل واحدة تلتقط منظر القلب من زاوية مختلفة و لكنه هو نفس المنظر ، مثل مباراة كرة القدم ، فنجد انه يوجد اكثر من كاميرا في الملعب و كل واحدة تلتقط منظرا معينا من زاوية معينة و لكن هي نفس المباراة .
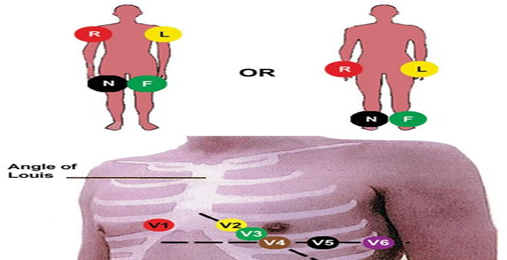
و جهاز رسم القلب ينتج لنا 12 صورة :
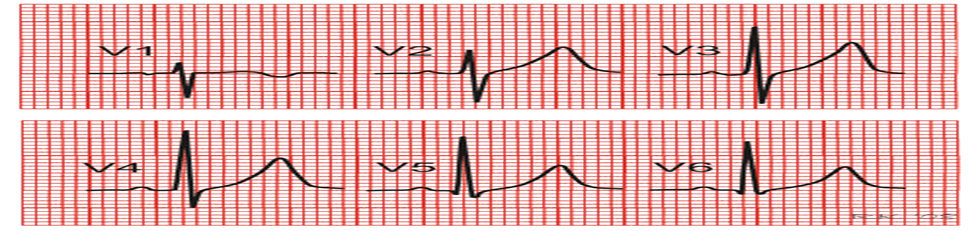
الستة أقطاب( كاميرات) التي علي الصدر تنتج لنا 6 صور مختلفة (leads) و تسمي V1,V2,V3,V4,V5,V6
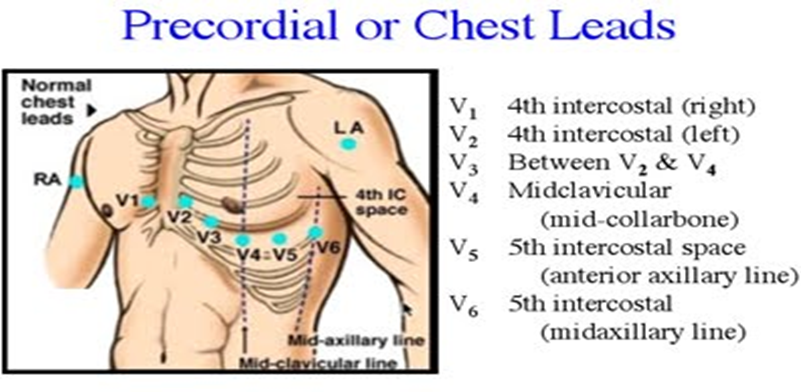
أماكن الأقطاب التي علي الصدر هي كالاتي :
· V1: في المسافة رقم 4 التي بين الضلوع علي اليمين . 4th intercostal space Rt
V2: في المسافة رقم 4 التي بين الضلوع علي اليسار Lt.4 th intercostal space
· V3: في النقطة ما بين V2&V1
V4: عند قمة القلب APEX
V5: في نفس مستوي قمة القلب عند خط الابط الامامي anterioer axillary line
V6: في نفس مستوس قمة القلب عند خط الابط المنتصفmid-axillary line
أماكن الوصلات :
الأقطاب التي علي الاطراف فكل واحدة تنتج لنا صورة ماعدا التي عند الساق اليسري فهي فقط للتوصيل الارضي لا تتدخل في الرسم .
· اليد اليمني تسمي : aVR
· اليد اليسري :aVL
· القدم اليسري : aVF
أما الثلاثة صور المتبقية فهما عبارة عن اندماج كل صورتين من الصور الناتجة عن الاقطاب الموجودة عند الاطراف
اندماج الصورة :
• اليد اليمني مع اليد اليسري تنتج لنا صورة تسمي:( lead I).
• اليد اليمني مع القدم تسمي : ( lead II ) .
• اليد اليسري مع القدم تسمي: ( lead III ).
وبما ان هذه الصور اندماج لاكثر من صورة فهي بالتالي تكون مكبرة (augmented) ولكي تكون الصور الناتجة كلها متساوية يقوم الجهاز بتكبير الصور الاخري الصادرة من الآطراف
( aVR , aVL, aVF) .
• حيث أن الحرف(V) يعني كلمة (Vector) أي المتجه اليها الكاميرا (electrode).
• (a) هي (augmented) أي مكبرة كما أوضحنا.
• (R) هي (Right arm) .
• (L) هي (Left arm).
• (F ) هي (Foot).
الصور تكون مرتبة كالاتي ( من الشمال لليمين طبعا ):
• Lead I, lead II, lead III, aVR, aVL , aVF, V1,V2,V3,V4,V5,V6))-
شكل رسم القلب :
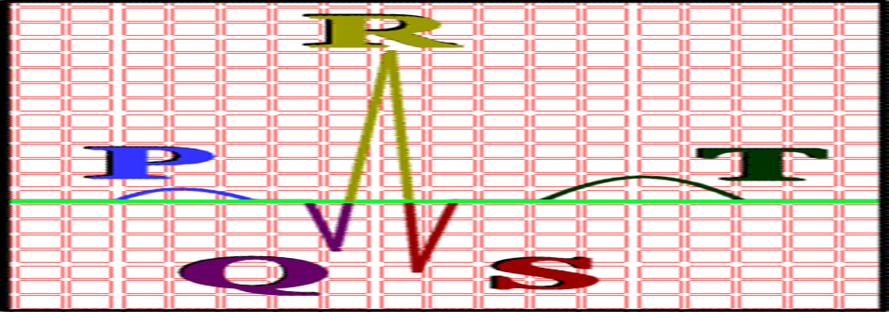
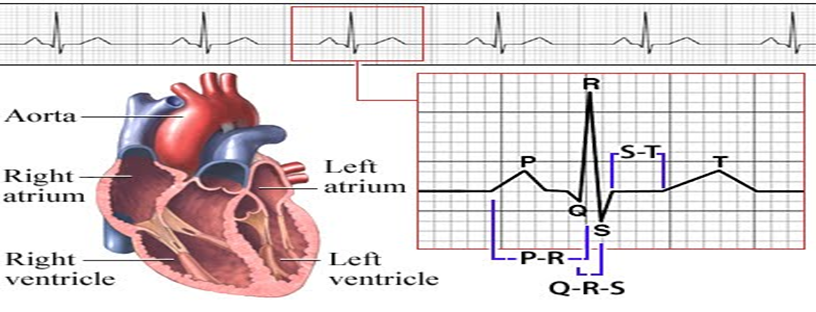
عضلات الاذينين أصغر من عضلات البطينين و لذلك فان التيار الكهربائي المصاحب لانقباض الاذينين سيكون صغيرا و يرمز له في رسم القلب برمز (الموجة ب) (P wave)،بينما انقباض البطينين يرمزله بالرمز (مجموعة كيو ار اس ) (QRS complex )، و بعدها يرمز لانبساط البطينين برمز ( الموجة ت) T wave ،حيث ان الدورة القلبية تبدأ بأنقباض الاذينين ثم انبساطهما ثم انقباض البطينين ثم انبساطهما ، و كل هذا يسجل كموجات في ورقة رسم القلب..
• انقباض الاذينين (الموجة ب) (P wave) - ثم انبساطهما (-)و هنا لا يسجل انبساط الاذينين لانه يحدث في نفس وقت انقباض البطينين و بالتالي انقباض البطينين يعوق تسجيل انبساط الاذينين.
• انقباض البطينين (مجموعة كيو أر أس) (QRS complex) - ثم أنبساطهما (الموجة تT wave).
• بالنسبة الي مجموعة (كيو أر اس) فاول انحناء لاسفل الخط المستقيم يسمي (موجة كيو) (Qwave) و الانحناء الذي يليه الي اعلي يسمي (موجة أر) (R wave) وهو ممكن يكون مسبوق ب (موجة كيو) أو لا ،ثم يليه لاسفل انحناء اخر يسمي (موجة اس) (S wave) و هو أيضا ممكن يكون مسبوقا بموجة كيو أو لا ... أي انه ليس شرطا أن يمثل انقباض البطينين بـ (مجموعة كيو أر اس) كلها .
• و أي تغير في هذه الصور يكشف عن مشكلة قد تكون في معدل ضربات القلب او نتيجة أنسداد شريان او شيء اخر، و لكن الصور الاكثر استخداما و الاكثر وضوحا هي (lead II) و (avR) و يستخدم احداهما لمتابعة حالة المريض في وحدات العناية المركزة، و ان كان الأكثر أستخداما هو (lead II).
يوجد 10 أقطاب (كاميرات) - electrodes)) - توضع علي الصدر و الساقين و الاذرع .... ينتج عنهما 12 صورة (leads) وهما كالاتي :
• (Lead I, lead II, lead III, aVR, aVL , aVF, V1,V2,V3,V4,V5,V6)
قاعدة مهمة
• ان كان اتجاه التيار الكهربائي في القلب في نفس اتجاه القطب ( الكاميرا) الموجهه فيكون الناتج انحناء سالب (لاسفل) علي ورقة رسم القلب ، و العكس ان كان اتجاه التيار عكس اتجاه الكاميرا فيكون الناتج انحناء موجب (لأعلي) علي ورقة رسم القلب ، وان كان اتجاه التيار ليس له علاقة باتجاه الكاميرا فتكون الاشارة ( الانحناء) له أي شكل.
و لذلك نجد ان أغلب انحناءات (lead II) موجبة (لأعلي) لان القطب ( الكاميرا ) الموجهة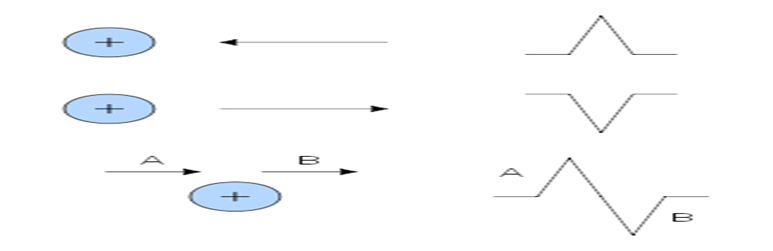
• تصور عكس اتجاه التيار ، أما أنحناءات (avR) فهي لاسفل لان الكاميرا الموجهه تصور في اتجاه التيار.
للقراءة رسم القلب يجب أتباع الأتى :
1. معدل ضربات القلب / الدقيقة.
2. ايقاع معدل ضربات القلب (منتظم أم لا).
3. أختلال محور القلب.
4. علامات وجود اقفار دموي ischemia.
5. الموجة ب (P wave ).
6. المسافة ب – أر P-R interval.
7. المجموعة كيو أر أس QRS complex.
8. الموجة ت T wave.
. الجزء أس – ت ST segment.
معدل ضربات القلب و إيقاعه :
• يلتقط جهاز رسم كهربائية القلب التيارات الكهربائية ويسجلها علي ورق رسم بياني ذات مربعات متساوية الحجم بمعدل منتظم حيث يحتوي ورق رسم القلب علي مربعات كبيرة وكل مربع كبير يحتوي علي 25 مربع صغير (5×5) و كل مربع صغير(1مم) يمثل 0.04 ثانية،وبالتالي كل مربع كبير( 5 مم) يمثل 0.2 ثانية اي أن 5 مربعات كبيرة تمثل (1ثانية) و 300 مربع كبير يمثل (1دقيقة) ومن ذلك
• يمكن ان نحسب معدل نبض القلب في الدقيقة فمثلا اذا وجدنا دورة القلب كاملة تتكرر كل مربع كبير أي أن القلب ينبض بمعدل 300 دقة/الدقيقة و هكذا
• قياس المسافة بين ( موجات أر ) ( R waves ) و بعضها _ علي أعتبار انها أعلي نقطة في الرسم _ تمثل معدل دقات القلب فالمسافة بين (أر_ أر) (intervalR- R) تمثل الوقت الذي أستغرق في توصيل التيارات الكهربائية خلال أجزاء القلب المختلفة
يمكن قياس معدل ضربات القلب كالاتي :
• معدل ضربات القلب =300 ( 300 مربع لحساب عدد دقات القلب في الدقيقة) ÷ المسافة بين ( أر- أر) ،و لكن هذا في حال ان يكون معدل ضربات القلب يسير بايقاع منتظم....
• وقياس الايقاع يتم عن طريق مطابقة المسافة بين (أر- أر) تكون متساوية في كل الصور،
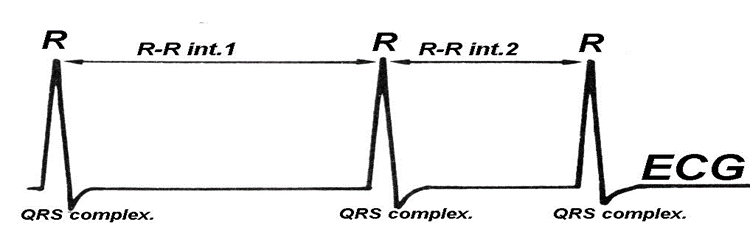
في حالة ان الايقاع غير منتظم فسنحسب معدل ضربات القلب كالاتي :
• معدل ضربات القلب = عدد (موجات ار _R waves) .
• في خلال6 ثواني × 10 .
هذه العملية الحسابية تتم علي طول صور رسم القلب لمدة 6 ثواني.
الموجة بى ((P wave:
• الفترة : هي تمثل فترة انقباض الاذينين .
• المدة : تساوي 0.08_0.12 ثانية أي من (2-3 ) مربع صغير و في بعض الاوقات يقال عنها انها (2.5× 2.5 ) مربع صغير طول في عرض.
الحالات التي يمكن تشخيصها من الأختلافات التي تحدث في (P wave ):
1- كبر حجم الاذين الايمن : أسبابه أرتفاع الضغط الرئوي (Pulmonary hypertension)
و يتم تشخصيه من زيادة ارتفاع (طول) الموجة (ب) اكثر من 3 مم نتيجة زيادة فترة انقباض الاذين الايمن لكبر حجمه و لان من اشهر اسبابه ارتفاع الضغط الرئوي(Pulmonary hypertension) فسميت (P wave) بإسم (P-Palmonale).
2- كبر حجم الاذين الايسر : أسبابه ضيق الصمام المترالي (Mitral stenosis)
و يتم تشخصيه من زيادة عرض الموجة (ب) اكثر من (0.11 ثانية) نتيجة زيادة فترة انقباض الاذين الايسر لكبر حجمه و لان من اشهر أسبابه ضيق الصمام المترالي (Mitral stenosis) فسميت (P wave) بإسم (P-Mitral).
المسافة ب - أر (P-R interval) :
• و هي تبدأ من بداية (الموجة ب) الي بداية (مجموعة كيو أر اس) أي من بداية لبداية و هي تمثل الوقت المستغرق لانتقال التيار الكهربائي من العقدة الجيب اذينية الي الاذينين و منه الي البطينين.
و هي تساوي = 0.12_ 0.20 ثانية أي من (3-5) مربعات صغيرة.
المجموعة كيو أر اس (QRS complex) :
• الفترة: تمثل الوقت المستغرق لانتقال التيار خلال البطينين.
• المدة: تساوي = 0.12 ثانية ( 3 مربعات صغيرة).
• التشخيص: كما ذكرنا فهي تساعد في تشخيص حالات الرجفان الاذيني و البطيني و الرفرفة الاذينية و انواع اضطرابات نظم القلب.
كما انها تساعد ايضا في تشخيص امراض الذبحة الصدرية و الجلطة كما سنوضح و امراض اخري للقلب.
• خط وهمي يرسم علي القلب يمثل محصلة التيار الكهربائي حيث ان اتجاه التيار الكهربائي في القلب يأتي من العقدة الجيب اذينية- كما اشارنا من قبل – الي أسفل وحيث ان البطين الايسر اكبر من البطين الايمن – لانه يغذي الجسم كله بالدم – فلذلك لو تخيلنا مسار التيار الكهربائي في القلب سيكون من اعلي الي أسفل و متجه ناحية اليسار قليلا....هذا ما يسمي بمحور القلب.
• أي تغييرات في هذا المحور تسمي اختلال محور القلب ناحية اليمين أو اليسار (Rt or Lt axial deviation)