Procedural Work For Electrocardiography
| Site: | EHC | Egyptian Health Council |
| Course: | Evidence of nursing procedures for internal sections |
| Book: | Procedural Work For Electrocardiography |
| Printed by: | Guest user |
| Date: | Saturday, 20 June 2026, 10:41 PM |
Description
"last update: 22 April 2025" تحميل الدليل
- اعداد
دليل الأقسام الداخلية
تحت اشراف
- أ.د/ محمد لطيف الرئيس التنفيذي للمجلس الصحي المصري - د/ كوثر محمود نقيب عام التمريض المصري – عضو مجلس الشيوخ
اعداد
|
م |
الاسم |
الوظيفة |
|
1 |
أ. د /امل احمد خليل مرسي |
نائب رئيس الجامعة لشئون التعليم والطلاب – جامعة بورسعيد |
|
2 |
أ.د / عفاف عبد العزيز عبد العزيز بصل |
عميد كلية التمريض –استاذ تمريض باطنه وجراحي جامعة طنطا |
|
3 |
أ.د/ زينب حسين على محمد سعد |
وكيل الكلية لشئون البيئة وخدمة المجتمع – كلية التمريض – جامعه حلوان |
|
4 |
أ.د /امل سعيد طه رفاعي |
أستاذ ورئيس قسم التمريض الباطني الجراحي – جامعة بنها |
|
5 |
أ.د /حنان احمد السباعي على |
استاذ التمريض التمريض الباطني الجراحي- كلية التمريض – جامعة القاهرة |
|
6 |
د /نيفين عبدربه النبي محمد عبد النبي |
رئيس الإدارة المركزية ندباَ –وزاره الصحة |
|
7 |
د /مايسه حسني احمد تمام |
مدير عام للإدارة ندباَ – وزاره الصحة |
|
8 |
د نانسي علاء الدين عبد الباسط على |
المشرف على التعليم الفني- الهيئة العامة للرعاية الصحية |
|
9 |
د شيرين محمد محمد سعدالدين |
المشرف على تطوير الخدمات التمريضية –الهيئة العامة للرعاية الصحية |
|
10 |
د/ مى محمود العسال |
مدير عام الإدارة العامة لشئون المعاهد الفنية الصحية |
|
11 |
أ.م.د/ هبة محمود محمد |
أستاذ مساعد تمريض صحة الام وحديثي الولادة –كلية التمريض - جامعة عين شمس |
|
المشاركين |
||
|
12 |
/أنهلة كامل مصطفي |
مسئول التمريض بالهيئة العامة للرعاية الصحية فرع الإسماعيلية |
|
13 |
/أمها سعد محمد النادي |
عضو إدارة التمريض بالهيئة العامة للرعاية الصحية فرع الإسماعيلية |
|
14 |
/أثروت عبد العال محمد |
عضو إدارة التمريض بالهيئة العامة للرعاية الصحية فرع الإسماعيلية |
|
15 |
أ /منى على عبد الرحمن الكتامى |
أخصائي تمريض بالإدارة العامة للتمريض- وزارة الصحة |
|
16 |
أ / شيرين عبد الحكيم عبد الحكيم خطاب |
أخصائي تمريض بالإدارة العامة للتمريض- وزارة الصحة |
|
17 |
أ/بهاء فؤاد برسوم |
أخصائي تمريض بالإدارة العامة للتمريض- وزارة الصحة |
- Definition
An electrocardiogram (ECG) refers to the electrical activity of the heart. It is a recording of the heart's electrical signals and is crucial for diagnosing various conditions, such as:
- Changes in regular heart rhythms.
- Helping in diagnosing the cause of chest pain.
- The use of thrombolytic therapy in cases of myocardial infarction (heart attack) depends on the ECG.
- It also helps in diagnosing the cause of breathlessness.
- Cardiac Electrophysiology and How the Heart Beats
Definition of Cardiac Electrophysiology: The contraction of any muscle is accompanied by electrical currents known as depolarization, and these currents can be recorded using electrodes placed on the surface of the body. This allows the recording of muscle contractions throughout the body. However, to clearly record the contraction of only the heart muscles, the person should be at rest, and all other body muscles should be relaxed.
Although the heart contains four chambers, only two chambers are visible in the ECG recording because the atria contract together, as well as the ventricles.
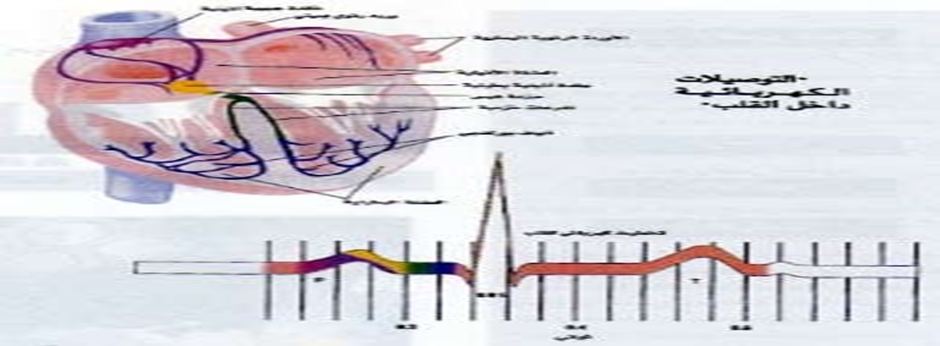
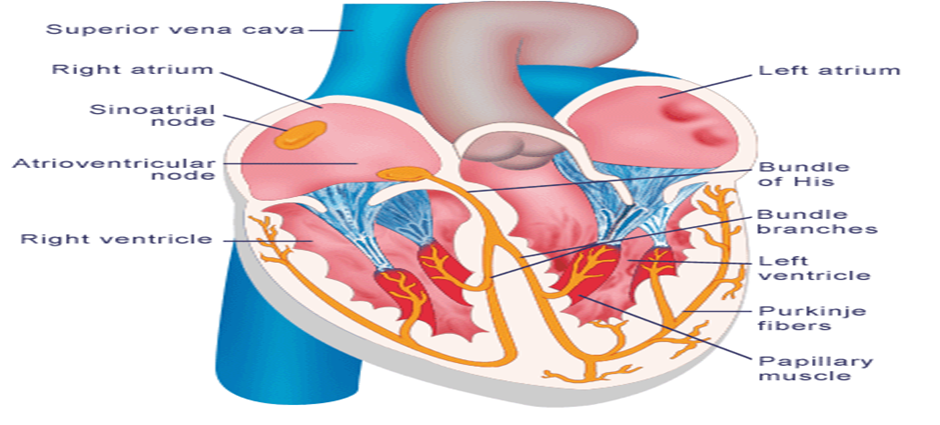
Normal Pulse:
The regular rhythmic heartbeats originate from within the heart muscle tissue itself, as it is self-regulating. The normal pulse begins with an electrical signal generated by a specialized, tiny electrical and neuro-muscular pacemaker located in the wall of the right atrium, known as the sinoatrial node (SA node), which generates electrical impulses at a rate of 60-100 beats per minute. This electrical signal rapidly spreads to both atria, causing them to contract and push blood from the atria into the ventricles. The signal then moves to the atrioventricular node (AV node), which is a small backup pacemaker located between the atria and ventricles. The AV node allows the electrical signal to pass through electrical pathways branching from it into the ventricles within a fraction of a second, causing the ventricles to contract and push blood out of the heart. The right ventricle pumps deoxygenated blood to the lungs for oxygenation, while the left ventricle pumps oxygenated blood to all parts of the body, providing tissues with the oxygen-rich blood. After oxygen is extracted from the blood, it returns to the right side of the heart, completing one full cycle of blood circulation.
Thus, in a healthy
human, electrical signals originate from the sinoatrial
node (SA node), and this is known as the sinus rhythm. However, in some pathological cases,
electrical impulses can arise from other sources, such as the atrioventricular node (AV node), which then results
in a nodal rhythm. In other cases,
the electrical impulses might come from other areas of the heart, such as the
ventricular muscles themselves. This could be due to the failure of the
sinoatrial node to generate impulses, or because an external source elsewhere
in the heart beats at a higher rate than the primary pacemaker, thus taking
over the rhythm of the heart.
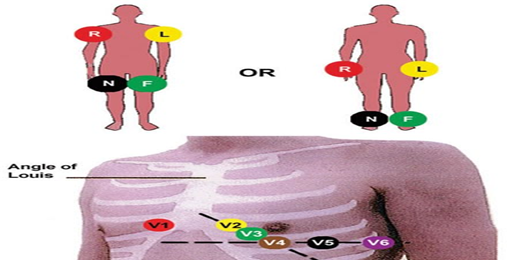
- Electrocardiogram (ECG) Leads
Each electrode connected to the body acts as a "camera." Ten electrodes are placed on the human body: one on each arm, one on each leg, and six points on the chest. As a result, we get 10 electrodes (or "cameras") from different angles. Each camera produces a different view of the heart, as each captures the heart from a different perspective, but it is the same image. This is similar to a football match where multiple cameras are used to capture the event from various angles.
Each one captures a specific view from a certain angle, but it is still the same match.
The ECG machine produces 12 images:
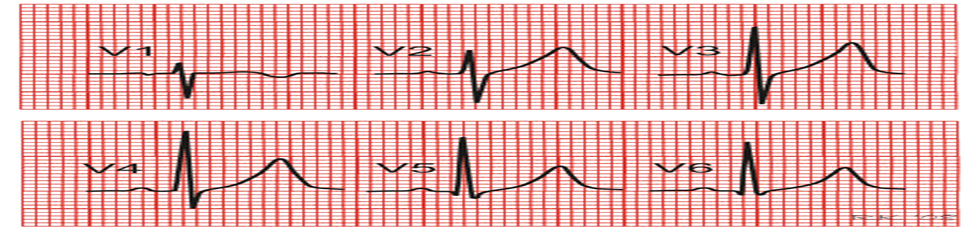
The six electrodes (cameras) on the chest produce 6 different images (leads), and they are named V1, V2, V3, V4, V5, and V6.
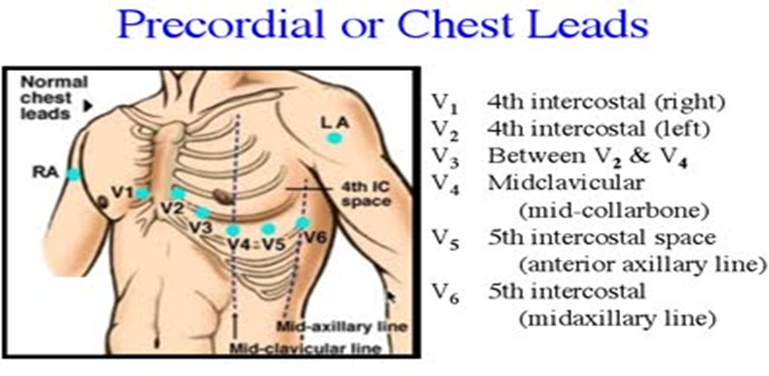
The positions of the electrodes on the chest are as follows:
- V1: In the 4th intercostal space on the right side.
- V2: In the 4th intercostal space on the left side.
- V3: At the midpoint between V2 and V1.
- V4: At the apex of the heart.
- V5: At the same level as the apex of the heart, at the anterior axillary line.
- V6: At the same level as the apex of the heart, at the mid-axillary line.
Electrodes on the limbs produce images, except for the one on the left leg, which serves only as a ground connection and does not participate in the recording. The images from the limb electrodes are:
- Right hand: aVR (augmented vector right)
- Left hand: aVL (augmented vector left)
- Left foot: aVF (augmented vector foot)
The remaining three images are the result of combining the images produced by the electrodes on the limbs:
- Right hand + Left hand: Lead I
- Right hand + Left foot: Lead II
- Left hand + Left foot: Lead III
Since these images are combinations of more than one electrode, they are augmented (magnified). To ensure that all images are of equal size, the device amplifies the images from the limb electrodes (aVR, aVL, aVF).
Explanation of Terms:
- (V): Stands for "Vector," indicating the direction towards which the camera (electrode) is placed.
- (a): Stands for "augmented," meaning the image is magnified.
- (R): Refers to the "Right arm."
- (L): Refers to the "Left arm."
- (F): Refers to the "Foot."
The Leads Order:
The leads are ordered as follows (from left to right):
- Lead I, Lead II, Lead III, aVR, aVL, aVF, V1, V2, V3, V4, V5, V6.
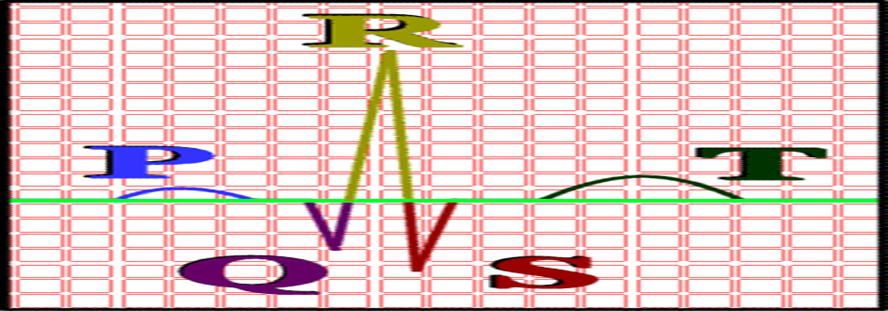
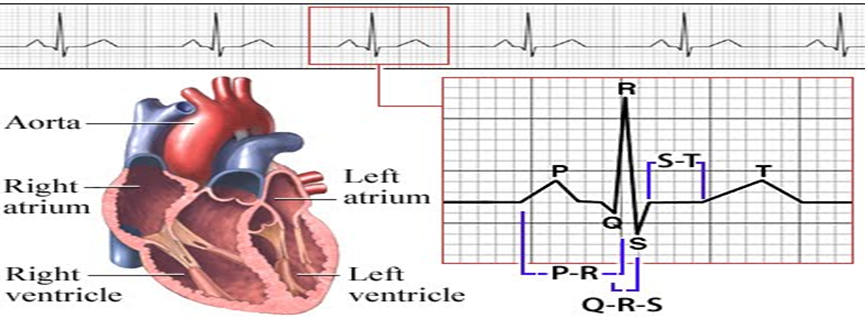
ECG Waveform:
- P wave: Represents the electrical activity associated with the contraction of the atria (smaller muscle compared to the ventricles).
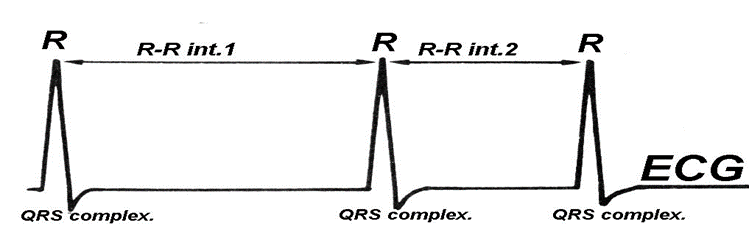
- QRS Complex: Represents the electrical activity associated with the contraction of the ventricles (larger muscle).
- T wave: Represents the relaxation or repolarization of the ventricles.
Sequence of Events in the Heart Cycle:
- Atrial Contraction: Represented by the P wave.
- Ventricular Contraction: Represented by the QRS complex.
- Ventricular Relaxation: Represented by the T wave.
- The QRS complex has three components:
- Q wave: The first downward deflection.
- R wave: The first upward deflection (which may or may not be preceded by the Q wave).
- S wave: The second downward deflection (which may or may not be preceded by the Q wave).
Significance of Changes:
Any change in these waveforms may indicate a potential problem, such as an abnormal heart rate, coronary artery blockage, or other heart-related issues. Among the leads, Lead II and aVR are commonly used for monitoring patients in intensive care units (ICUs), with Lead II being the most frequently used for this purpose.
ECG Electrodes (Cameras) and Leads:
There are 10 electrodes (cameras) placed on the chest, limbs, and legs, which result in 12 leads (images) on the ECG tracing. These leads are as follows:
- Lead I
- Lead II
- Lead III
- aVR (augmented vector right)
- aVL (augmented vector left)
- aVF (augmented vector foot)
- V1
- V2
- V3
- V4
- V5
- V6
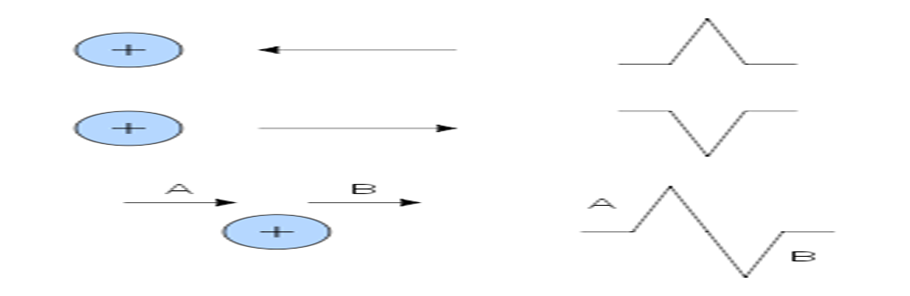
Important Rule:
- If the direction of the electrical current in the heart is aligned with the direction of the electrode (camera), the result will be a negative deflection (downward) on the ECG paper.
- If the direction of the electrical current is opposite to the direction of the electrode, the result will be a positive deflection (upward) on the ECG paper.
- If the direction of the electrical current is perpendicular to the direction of the electrode, the resulting deflection (bend) can take any shape.
Observations:
- As a result of this principle, we typically see positive (upward) deflections in Lead II, because the electrode (camera) in Lead II is generally oriented in the direction of the heart's electrical current, which flows from the top right (the sinoatrial node) to the bottom left (the apex of the heart). Hence, most of the deflections in Lead II are positive (upward).
The deflection is opposite to the direction of the current. However, the deflections in aVR are downward because the electrode (camera) is oriented in the direction of the current.
To read an electrocardiogram (ECG), the following steps should be followed:
- Heart rate per minute.
- Rhythm of the heart rate (regular or irregular).
- Cardiac axis deviation.
- Signs of myocardial ischemia.
- P wave.
- P-R interval.
- QRS complex.
- T wave.
- ST segment.
Heart Rate and Rhythm:
- The electrocardiogram (ECG) device captures electrical currents and records them on a graph paper with evenly spaced squares. The ECG paper contains large squares, each of which is divided into 25 small squares (5x5). Each small square (1 mm) represents 0.04 seconds. Therefore, each large square (5 mm) represents 0.2 seconds, meaning that 5 large squares represent 1 second, and 300 large squares represent 1 minute.
- By using this system, the heart rate can be calculated. For example, if one complete cardiac cycle is represented by one large square, the heart beats at a rate of 300 beats per minute.
- The measurement of the distance between the R waves (R waves being the highest point in the ECG) reflects the heart rate. The distance between two successive R waves (R-R interval) represents the time it took for the electrical signals to travel through the different parts of the heart.
How to calculate the heart rate?
- Heart rate = 300 ÷ (distance between R-R intervals in large squares). This calculation is valid when the heart rate follows a regular rhythm.
- The rhythm can be assessed by checking whether the distance between successive R-R intervals is consistent across the different leads of the ECG.
In case of irregular rhythm, heart rate is calculated as follows:
- Heart rate =
Number of R waves within 6 seconds × 10.
This calculation is done over a 6-second period in the ECG.
P Wave:
- Duration: The P wave represents the period of atrial contraction.
- The duration is 0.08-0.12 seconds, which equals 2-3 small squares (sometimes referred to as 2.5 x 2.5 small squares in size).
Conditions Diagnosed by P Wave Abnormalities:
1. Enlargement of the right atrium: This can be caused by pulmonary hypertension. It is diagnosed by an increase in the height (length) of the P wave to more than 3 mm, which reflects the prolonged contraction of the right atrium due to its enlargement. This condition is referred to as P-Pulmonale due to its association with pulmonary hypertension.
2. Enlargement of the left atrium: This can be caused by mitral stenosis. It is diagnosed by an increase in the width of the P wave to more than 0.11 seconds, which reflects the prolonged contraction of the left atrium due to its enlargement. This condition is referred to as P-Mitral, named after mitral stenosis.
P-R Interval:
- The P-R interval is the time taken for the electrical impulse to travel from the sinoatrial (SA) node through the atria and into the ventricles.
- It starts from the beginning of the P wave to the beginning of the QRS complex.
- Duration: 0.12-0.20 seconds (3-5 small squares).
QRS Complex:
- Duration: The QRS complex represents the time taken for the electrical impulse to travel through the ventricles.
- The duration is 0.12 seconds (3 small squares).
Diagnosis:
- The QRS complex is crucial for diagnosing conditions such as atrial fibrillation, ventricular fibrillation, atrial flutter, and other heart rhythm disorders.
- It is also used in diagnosing conditions like angina and myocardial infarction (heart attack), among other cardiac diseases.
The QRS complex represents the net direction of the electrical current in the heart. The electrical impulse originates from the sinoatrial (SA) node, travels downward, and, since the left ventricle is larger than the right ventricle (as it supplies blood to the entire body), the impulse travels downward and slightly to the left. This is referred to as the heart's axis.
Axis Deviation:
Any changes in the heart's axis are called right or left axis deviation (Rt or Lt axial deviation).