Rationalizing the use of caesarean section in Egypt through implementing 10 group Classification system
| Site: | EHC | Egyptian Health Council |
| Course: | Obstetric and Gynecology Guidelines |
| Book: | Rationalizing the use of caesarean section in Egypt through implementing 10 group Classification system |
| Printed by: | Guest user |
| Date: | Saturday, 20 June 2026, 9:37 PM |
Description
"last update: 12 June 2025 Download Guideline
Table of contents
- - Objectives
- - Introduction
- - Caesarean section status in Egypt
- - Is there a standard accepted CS delivery rate?
- - How monitoring of CS rate can be achieved?
- - Indication of CS
- - Explanation of some indication
- - May cesarean section be regarded as an alternative to spontaneous delivery?
- - CS classification systems and Robson Clssification
- - What are the variables of Robson Classification?
- - General considerations and definitions in using Robson Classification System
- - How to classify women in Robson classification?
- - The Robson Classification Report Table
- - References
- Objectives
· Be aware of the cs rate and its burden on health system .
· Help you to recognize the absolute indications of cs .
· Help you in assessing and validating the relative indications of CS.
· Helps you to understand and implement the Robson Classification and build the Report Table using your own data
· Identify the complications of CS
· To help healthcare facilities and obstetricians in adopting and using the Robson Classification. It presents a standard approach to implement and interpret this classification
· Explains the variables and definitions used and how to produce and interpret the Report Table
· Highlights challenges that you may encounter and shares useful experiences and examples from users
- Introduction
Caesarean section (CS) is a lifesaving procedure that is performed when an obstetric condition precludes vaginal delivery.(1) The CS rate is widely considered an important global indicator for measuring access to obstetric services(2)and safe and timely care for mothers and newborns. Ensuring access to CS is an essential strategy to reduce maternal mortality (3)
Compared with vaginal delivery, CS also necessitates more health personnel and entails higher costs both for hospitals and for society.(4) Nevertheless, over the past three decades CS rates have increased steadily in many countries, especially in middle- income and high- income ones, a phenomenon that has become a major public health concern.(5)
- Caesarean section status in Egypt
Egypt has the third highest worldwide caesarean section (CS) rate following the Dominican Republic (56.4%) and Brazil (55.6%) (7) The most recent official Egypt Demographic and Health Survey (EDHS) was in 2014 and showed that 52% of childbirths in Egypt are by CS, an estimated 1,350,000 CS/year In fact, the annual number of CS in Egypt is higher than that in the USA (1.2 million 2018) despite the latter having 3.5x higher population than Egypt.(7) this rate was very alarming as it is almost double that reported at the time of the 2008 EDHS (28 %) and 2.5 times the level observed at the time of the 2005 EDHS (19.9 %) . this is the highest rate in the MENA region which is more than double that of Jordan and Saudi Arabia, and more than 4 times that of Kuwait. Egypt’s regional neighbors ( 8 ). This very high rate of cs and its sharp increasing trend indicates that these rates have virtually nothing to do with evidence-based medicine and this was given as example of unnecessary cs in FIGO position paper on the rise of cs .(9)
- Is there a standard accepted CS delivery rate?
In 1985, the World Health Organization (WHO) put the acceptable rate of CS as between 10 and 15 percent of all births. There is “no justification for any region to have cesarean section rates higher than 10–15 percent” (WHO. The panel’s conclusion was drawn from a review of the limited data available at the time, mainly from northern European countries that demonstrated good maternal and perinatal outcomes with this rate of caesarean section.(1)
In April 2015, WHO released a new statement summarizing the results of systematic reviews and analysis of the available data on caesarean births concluded that, at population level, caesarean section rates higher than 10% were not associated with reductions in rates of maternal and newborn mortality (6,11). The statement notes, however, that the association between caesarean section rates and other relevant outcomes such as stillbirths, maternal and perinatal morbidity, pediatric outcomes and psychological or social well-being could not be determined due to the lack of data on these outcomes .WHO emphasizes that caesarean section is effective in saving maternal and infant lives, but only when it is used for medically indicated reasons. Ultimately, every effort should be made to provide caesarean sections to women in need, rather than striving to achieve a specific rate.
- How monitoring of CS rate can be achieved?
Traditionally, at facility level, monitoring of CS rates is done by using the overall percentage of deliveries by CS. Variations in this “overall CS rate” between different settings or over time are difficult to interpret and compare because of intrinsic differences in hospital factors and infrastructure (e.g. primary versus tertiary level), differences in the characteristics of the obstetric population (“case-mix”) served (e.g. percent of women with previous CS) and differences in clinical management protocols (e.g. conditions for induction or pre-labour CS). Ideally, there should be a classification
system to monitor and compare CS rates at facility level in a standardized, reliable, consistent and action-oriented manner (12, 13, 14)
Before going to the classification system in depth, it is important to have a clear agreement on the internationally recognized CS indications- Indication of CS
The decision to perform a cesarean section is based primarily on the question of what is best for or may save the lives of the mother and child. The indications for cesarean section can therefore be divided into absolute and relative indications where absolute indications is constitute only 10 % of the causes and the majority of CS indications are relative(15)
Absolute indications of cs include
· Abnormal lie and presentation
· Absolute disproportion in cases of very small pelvis
· Chorioamnionitis (amniotic infection syndrome) without labour
· Maternal pelvic deformity
· Eclampsia and HELLP syndrome
· Fetal asphyxia or fetal acidosis
· Umbilical cord prolapse
· Placenta previa
· Uterine rupture
Relative indications of CS include
· Pathological cardiotocography (CTG)
May provide indication of acute hypoxia or fetal asphyxia. If fetal acidosis occurs, the birth should be completed either as an instrumental delivery or by cesarean section.
· Failure to progress in labor (prolonged labor, secondary arrest)
· Previous cesarean section
· Abruptio placentae
- Explanation of some indication
Will follow here the NICE guidelines (16)
1- Breech presentation
Cs should be offered to pregnant women with a singleton breech presentation at term, for whom external cephalic version is contraindicated or has been unsuccessful
On the other hand, Women who have an uncomplicated singleton breech pregnancy at 36 weeks' gestation should be offered external cephalic version Except ( women in labour and women with a uterine scar or abnormality, fetal compromise, ruptured membranes, vaginal bleeding or medical conditions.
2- Cs in multiple pregnancy
This include twin pregnancy (with all variants ) and triple pregnancy
A) Twin pregnancy ( dichorionic diamniotic or monochorionic diamniotic )
1- Discus and explain to women with an uncomplicated twin pregnancy planning their mode of birth that planned vaginal birth and planned caesarean section are both safe choices for them and their babies if all of the following apply:
· the pregnancy remains uncomplicated and has progressed beyond 32 weeks
· there are no obstetric contraindications to labor
· the first baby is in a cephalic (head-first) presentation
· there is no significant size discordance between the twins.
2- Caesarean section is recommended to women if the first twin is not cephalic at the time of planned birth either full term or preterm between 26 and 32 weeks
3- Offer an individualized assessment of mode of birth to women in suspected, diagnosed or established preterm labor before 26 weeks taking into account the complications of cs and neonatal standards.
B) Twin pregnancy: monochorionic monoamniotic
Offer a caesarean section to women with a monochorionic monoamniotic twin pregnancy:
· at the time of planned birth
· after any complication is diagnosed in her pregnancy requiring earlier delivery
· if she is in established preterm labour, and gestational age suggests there is a reasonable chance of survival of the babies (unless the first twin is close to vaginal birth and a senior obstetrician advises continuing to vaginal birth)
C ) Triplet pregnancy Cs should be done in cases of
· At the time of planned birth
· After any complication is diagnosed in her pregnancy requiring earlier delivery
· If she is in established preterm labour, and gestational age suggests there is a reasonable chance of survival of the babies.
3- Placenta Previa
Women with a placenta that partly or completely covers the internal cervical os (minor or major placenta praevia) should be offered CS.
4- Morbidly adherent placenta Morbidly adherent placenta
Cs is the role here however obstetrician should ensure that:
• A consultant obstetrician and a consultant anaesthetist are present
• An experienced paediatrician is present
• A senior haematologist is available for advice
• A critical care bed is available
• Sufficient cross-matched blood and blood products are readily available.
All hospitals should have a locally agreed protocol for managing morbidly adherent placenta that sets out how these elements of care should be provided and the decision with conservative surgery of hysterectomy should be balanced .
5- Predicting CS for cephalopelvic disproportion before labour
Is not accurate method for assessment and should not be considered indication of cs .
6- Mother-to-child transmission of maternal infection
-HIV/AIDS
- Do not offer a CS in the following conditions( as the risk of transmission is the same with vaginal and cs delivery )
• if Women on highly active anti-retroviral therapy (HAART) with a viral load of less than 400 copies per ml
• Women on any anti-retroviral therapy with a viral load of less than 50 copies per ml.
- Offer a CS to women with HIV who:
• are not receiving any anti-retroviral therapy
• are receiving any anti-retroviral therapy and have a viral load of 400 copies per ml or more.
- Hepatitis B virus
Not an indication for cs
- Hepatitis C virus
Alone is not indication for cs
Cs indicated if it is co-infected with HIV
-Herpes simplex virus Herpes simplex virus
Cs is indicated in primary genital infection in the third trimester
7- Other emerging factor for conduct of cs
Legal aspects
Over the past decades, the mode of delivery has increasingly become a matter of risk- orientated, defensive obstetric practice. This must largely be seen as a consequence of the increase in guidelines and regulations. The costs of damage claims can at present can be very high in the whole world an in in Egypt in addition to legal responsibilities. (15)
Maternal request for CS
Cesarean delivery on maternal request that is defined as an elective cesarean in the absence of any medical or obstetric contraindication for attempting vaginal delivery (17,18)—is the most frequently cited reason for the increasing incidence of cesarean sections . C certainly, recent years have seen an increase in mothers expressing a wish for cesarean delivery on the basis of assumed advantages compared to vaginal delivery (15)
CS on maternal request is usually a result of anxiety about childbirth and it should be notice that the newly coined term “tocophobia” is mainly used in Scandinavia and the Anglo-American countries to describe strong fear of spontaneous childbirth.. The incidence of this unfortunately named condition is cited as between 6% and 10% (19,20
). every effort should be done including referral to a healthcare professional with expertise in providing perinatal mental health support to help her address her anxiety in a supportive manner however if after discussion and perinatal mental health
support ,a vaginal birth is still not an acceptable option, offer a planned CS at the 39th weeks of gestation(21)
Increased maternal age
The increase in mean maternal age appears to have a substantial role in cesarean rates. For some years now, pregnancy in a woman aged over 35 years has been considered a high-risk pregnancy. As maternal age rises, so does the risk of fetal congenital malformations, hypertension, or even diabetes mellitus. Age is not in itself an indication for cesarean section; rather, it is the occurrence of specific risks in this age group that may lead to an indication for cesarean delivery(22.23)
Obesity
Since the prevalence of obesity is continually rising (e38, e39), the logical result is that the probability is also increasing for associated medical disorders like hypertension and DM in addition to fetal macrosomia and hence associated increase of CS so again obesity by itself is not indication of CS rather than ,it is the consequence of specific risks associated .(15)
Infertilty and ART treatment
Another much-discussed reason for the observed i ncrease in cesarean deliveries is the rise in assisted reproductive interventions , which increasingly are leading to multifetal pregnancies .in fact Reproductive interventions in themselves do not lead to an increased cesarean rate, but maternal anxiety about a healthy outcome for her child may also play an important part.(24,25)
- May cesarean section be regarded as an alternative to spontaneous delivery?
To answer this question which is a common one in practice nowadays? Two issues will be discussed (15)
A- a cesarean section remains a surgical operation, and as such it also has side effects and complications
B- Comparison of complications of elective cesarean section and planned vaginal delivery
( A ) Complications of CS
Cesarean section remains a surgical operation, and as such it also has complications that can be intraoperative, post-operative or complications in subsequent pregnancies
Intraoperative complications
· Infections
· Organ injury (bladder, intestines, ureter, etc.)
· Risks associated with anesthesia
· Need for blood transfusions
· Hysterectomy as a treatment for severe bleeding, e.g. from p lacenta praevia Postoperative complications
· Thromboembolic complications (embolism, thrombosis)
· Adhesions
· Persistent pain
Complications in subsequent pregnancies
· Intrauterine growth retardation and preterm delivery
· Spontaneous abortion
· Ectopic pregnancy
· Stillbirth
· Uterine rupture
· Infertility
· Placenta previa and Morbidly adherent Placenta
( B ) Comparison of complications of elective cesarean section and planned vaginal delivery
The data are based on the NICE guideline, in which the few prospective studies that exist were evaluated according to the criteria of evidence-based medicine (EBM).
i. Risks reduced after elective cesarean:
– Abdominal and perineal pain during the birth
– Abdominal and perineal pain 3 days after the birth
– Vaginal injuries
– Anesthesia-related emergencies (shock, bleeding)
ii. Risks reduced after vaginal delivery
– Duration of hospital stay
– Hysterectomy due to postpartum bleeding
– Cardiac arrest
iii. No differences
– Abdominal and perineal pain 4 months after the birth
– Injuries to nearby organs (bladder, ureter, or cervix)
– Pulmonary embolism
It is documented that Maternal morbidity in elective cesareans is only slightly higher than that for vaginal deliveries however the remote effects on subsequent pregnancies carry more morbidities especially with morbid adherent placenta meaning that planned elective cs is not alternative to vaginal delivery on the other hand c should be used in indicated cases .(26)
- CS classification systems and Robson Clssification
Different authors have created and proposed several types of CS classification systems for use at facility level for different purposes, with the overall aim of providing a consistent and standardized framework to look at CS (27). In 2011 the World Health Organization (WHO) conducted a systematic review that identified 27 different systems to classify CS. These classifications looked at “who” (woman-based), “why” (indication- based), “when” (urgency-based), as well as “where”, “how” and “by whom” a CS was performed. This review concluded that women-based classifications in general, and the 10-Groups classification in particular, were in the best position to fulfill current international and local needs(28)
Unlike classifications based on indications for CS, the Robson Classification is for “all women” who deliver at a specific setting (e.g. a maternity or a region) and not only for the women who deliver by CS. It is a complete perinatal classification.
Since this system can be used prospectively and its categories are totally inclusive and mutually exclusive, every woman who is admitted for delivery can be immediately classified, based on a few basic characteristics which are usually routinely collected by obstetric care providers worldwide. The strength of this classification came from being simple, robust, reproducible, clinically relevant, and prospective.
Values of using Robson Classification
• Identify and analyze the groups of women which contribute most and least to overall
CS rates.
• Compare practice in these groups of women with other units who have more desirable
results and consider changes in practice.
• Assess the effectiveness of strategies or interventions targeted at optimizing the use of
CS.
• Assess the quality of care and of clinical management practices by analyzing outcomes
by groups of women.
• Assess the quality of the data collected and raise staff awareness about the importance
of this data, interpretation and use.
- What are the variables of Robson Classification?
Parity, previous CS, onset of labor, gestational age, number of fetuses, lie and presentation of the fetus. are the variables for Robson classification that can be assessed as shown in table 1
Table 1 variant for Robson Classification
|
parity |
· Nullipara ( no deliveries before ) · Multipara ( one or more deliveries irrespective of the mode of delivery and the outcome of delivery ) |
|
Previous CS |
· Yes · No ( no previous CS even if there are multiple vaginal deliveries before ) |
|
Onset of labour |
· Spontaneous ( women who entered labour spontaneously even if she received oxytocin or had an amniotomy performed for augmentation (acceleration) of labour after that . · Induced (woman was not in labour and was then induced by any method of induction is valid including amniotomy, misoprostol, oxytocin, intracervical Foley balloon, laminariaor other. ) · Prelabour CS ( planned elective CS before the onset of labour ) |
|
Number of Fetuses |
· Singleton ( even if dead more than 22 weeks of gestation ) · Multiple ( irrespective to living condition as long as they are more than 22 weeks ) |
|
Gestational Age |
· Preterm (less than 37 weeks) · Full term (37 weeks or more) |
|
Fetal lie and Presentation |
· Cephalic presentation · Breech presentation · Transverse lie |
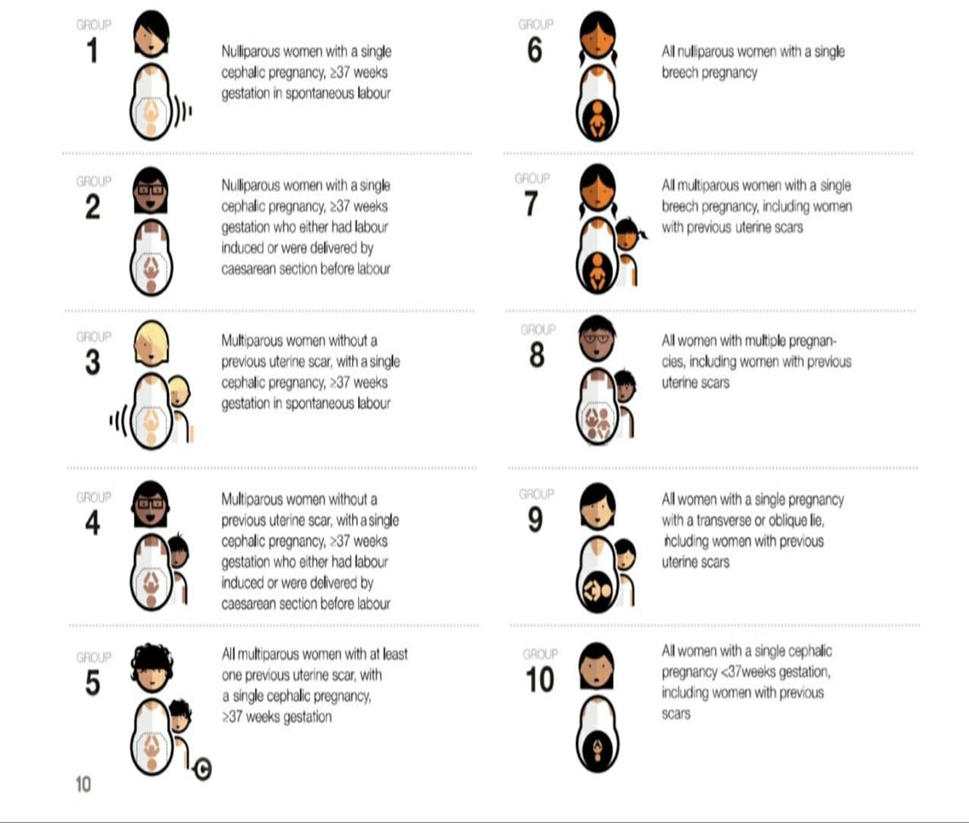
According to these variables, 10 groups classification system was created known as Robson classification as shown in table 2 and figure 1
Table 2 -10 groups Robson classification
|
Group 1 |
Nulliparous with single cephalic pregnancy, ≥37 weeks gestation in spontaneous labour |
|
Group 2 |
Nulliparous with single cephalic pregnancy, ≥ 37 weeks gestation who either had labour induced or were delivered by CS before labour |
|
Group 3 |
Multiparous without a previous uterine scar, with single cephalic pregnancy, ≥37 weeks gestation in spontaneous labour |
|
Group 4 |
Multiparous without a previous uterine scar, with single cephalic pregnancy, ≥37 weeks gestation who either had labour induced or were delivered by CS before labour |
|
Group 5 |
All multiparous with at least one previous uterine scar, with single cephalic pregnancy, ≥37 weeks gestation |
|
Group 6 |
All nulliparous women with a single breech pregnancy |
|
Group 7 |
All multiparous women with a single breech pregnancy including women with previous uterine scars |
|
Group 8 |
All women with multiple pregnancies including women with previous uterine scars |
|
Group 9 |
All women with a single pregnancy with a transverse or oblique lie, including women with previous uterine scars |
|
Group 10 |
All women with a single cephalic pregnancy < 37 weeks gestation, including women with previous scars |
Fig 1 Robson groups
- General considerations and definitions in using Robson Classification System
The Robson Classification should be considered as a common starting point for a perinatal classification system that can be further developed. Each of the 10 groups may need to be subdivided or some groups may need to be combined. In addition, more details such as indications for caesarean sections or neonatal morbidity can be added and analysed within the different groups. Other events and outcomes related to labour and delivery can also be analysed within the group (e.g. oxytocin or epidemiological variables such as age or body mass index). Moreover, there are several key obstetrical definitions, protocols or procedures which are not included in the classification but should be considered when interpreting the results.(29)
The definition of a “birth” may vary between countries and settings. While most high- income countries count births as infants weighing at least 500 g or with a gestational age at least 20 or 22 weeks, many countries use other cut-offs. For example, the threshold of viability in many countries is birth weight ≥ 1000 g and gestational age ≥ 28 weeks. In order to compare Robson Report Tables between countries and within countries over time, it is important that the users of the classification give a clear definition of what were the weight and gestational age cutoffs used in their population. This should be added as a footnote in their Robson Report Table.
Age of medicolegal viability. Not well documented in Egypt however it is used in the majority of the units to be 28 weeks of gestation
SPONTANIOUS LABOUR start of labor without any artificial initiation
Induction of labour is defined as the process of artificially stimulating the uterus to start labour. It is usually performed by administering oxytocin or prostaglandins to the pregnant woman or by manually rupturing the amniotic membranes (30)
The latent first stage is a period of time characterized by painful uterine contractions and variable changes of the cervix, including some degree of effacement and slower progression of dilatation up to 5 cm for first and subsequent labours.(30)
The active first stage is a period of time characterized by regular painful uterine contractions, a substantial degree of cervical effacement and more rapid cervical dilatation from 5 cm until full dilatation for first and subsequent labours (31)
Augmentation of labour .acceleration of already started uterine contraction and hence delivery (31)
Subdivision of Robson Groups
Many suggestions for Robson Classification groups subdivisions have been recoded
(12). Subdivisions of certain groups (e.g. Groups 2, 4 or 5) may prove to be more meaningful than others. The objective of the subdivisions is to further increase the uniformity and homogeneity of the groups by stratifying women within that group according to certain relevant characteristics. This can be especially useful when planning the implementation of clinical interventions in specific subgroups. The importance and potential usefulness of these subdivisions will depend on the size of the groups within the specific setting where the classification will be used. However, it is important to remember that the analyses of any subdivision by itself may be misleading if no attention is given to what has been left out. For this reason it is recommended that before looking at subgroups users become accustomed to first analyse the 10 groups. Otherwise, the data may be misinterpreted. Table 3
Subdivion of group 2 and 4
Refer to nulliparous and multiparous women without previous CS, respectively, with a singleton, term fetus in cephalic presentation who did not enter labour spontaneously and this can be subdivided either their have labour induction or prelabour planned cs .
Since Groups 2 and 4 may represent a large proportion of the obstetric population in many hospitals, these subcategories are important to understand how differences in clinical practice (rates of induced labouror pre-labourCS) contribute to the rates of CS in nulliparous and multiparous women without a previous CS, as well as the overall CS rates in different hospitals. Additionally, the rate of CS in Subgroups 2a and 4a can also be used to assess and compare the success of induction guidelines in different hospitals or in the same hospital over time
Group 5 includes all multiparous women with at least one previous CS carrying a singleton, term fetus in cephalic presentation. In current obstetric practice, Group 5 can be very important in many settings because there is a growing number of women with previous CS and therefore the size of this group may be quite significant. Since the rate of CS in this group is usually high, Group 5 may be an important contributor to the total number of CS in these settings. However, Group 5 includes two distinct and mutually exclusive subcategories, namely
Group 5 (1) with only one previous CS section And a group (2) with two or more CS .
Given the differences in clinical management of these two types of women, these common subcategories should be reported separately in the classification, as 5.1 and 5.2. The usefulness of these subcategories will depend on the actual size of Group 5 in a specific setting. In many high-and middle-income countries where the size of Group 5 is becoming substantial, the proposed subcategories will be more useful and appreciated than in places where Group 5 represents only a small proportion of the obstetric population. This subgrouping will give a potentiality of VBAC 9 vaginal birth after caesarean section) trial in cases of 5 (1) subgroup which will be much difficult to be conducted with group 5 (2)
Table 3 Robson Groups with subdivision
|
Group 1 |
Nulliparous with single cephalic pregnancy, ≥37 weeks gestation in spontaneous labour |
|
Group 2 |
Nulliparous with single cephalic pregnancy, ≥ 37 weeks gestation who either had labour induced or were delivered by CS before labour |
|
2 A |
Labour induced |
|
2 B |
Pre-labourCS |
|
Group 3 |
Multiparous without a previous uterine scar, with single cephalic pregnancy, ≥37 weeks gestation in spontaneous labour |
|
Group 4 |
Multiparous without a previous uterine scar, with single cephalic pregnancy, ≥37 weeks gestation who either had labour induced or were delivered by CS before labour |
|
4A |
Labour induced |
|
4 B |
Pre-labourCS |
|
Group 5 |
All multiparous with at least one previous uterine scar, with single cephalic pregnancy, ≥37 weeks gestation |
|
5A |
With one previousCS |
|
5 B |
With two or more previous CSs |
|
Group 6 |
All nulliparous women with a single breech pregnancy |
|
Group 7 |
All multiparous women with a single breech pregnancy including women with previous uterine scars |
|
Group 8 |
All women with multiple pregnancies including women with previous uterine scars |
|
Group 9 |
All women with a single pregnancy with a transverse or oblique lie, including women with previous uterine scars |
|
Group 10 |
All women with a single cephalic pregnancy < 37 weeks gestation, including women with previous scars |
- How to classify women in Robson classification?
This can be as simple as going manually through each patient record looking for the core variables and adding a manual note with a pencil with the number of the Robson group. Or, it can be as complex as asking a team of information specialists to create software which picks the core variables in the electronic patient record and automatically assigns the specific Robson group to each record, based on pre- established formulas. (See table 4 )
The following flow chart (fig 2 ) provides guidance about the order in which the categorization can be most easily performed. Cases with missing data (no information in one or more of the six core variables) should be categorized as “Unclassifiable” and the missing variable should be noted to facilitate analyses of these cases.
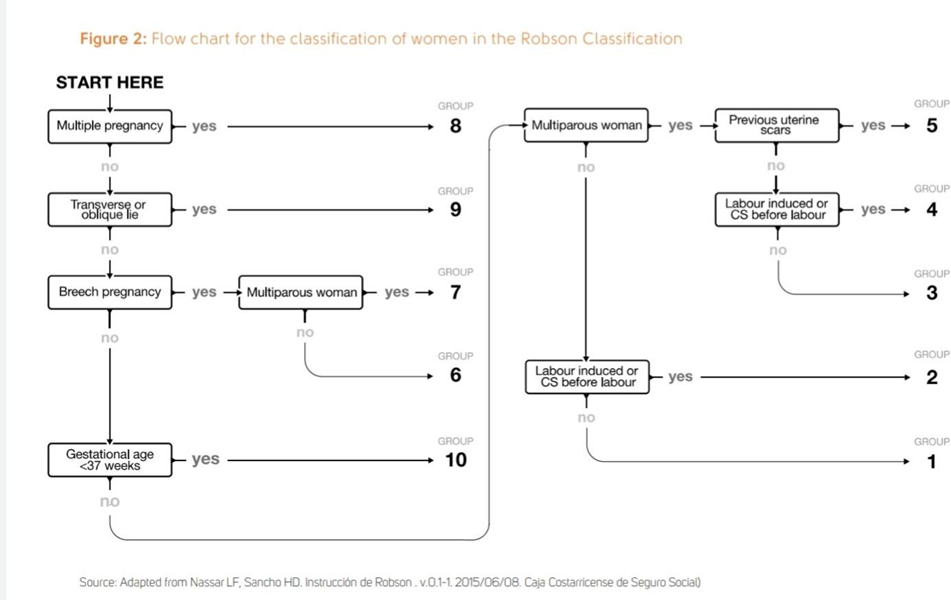
Table 4: Summary of specifications for variables in each Robson group
|
Grou p |
Parit y |
Previou s CS |
Numb er of fetuses |
Fetal presentatio n or lie |
Gestationa l age (weeks) |
Onset of labour |
|
1 |
0 |
No |
1 |
Cephalic |
≥ 37 |
Spontaneou s |
|
2 |
0 |
No |
1 |
Cephalic |
≥ 37 |
Inducedor CSbefore labour |
|
3 |
≥ 1 |
No |
1 |
Cephalic |
≥ 37 |
Spontaneou s |
|
4 |
≥ 1 |
No |
1 |
Cephalic |
≥ 37 |
Inducedor CSbefore labour |
|
5 |
≥ 1 |
Yes |
1 |
Cephalic |
≥ 37 |
Any |
|
6 |
0 |
No |
1 |
Breech |
Any |
Any |
|
7 |
≥ 1 |
Any |
1 |
Breech |
Any |
Any |
|
8 |
Any |
Any |
≥
2 |
Any |
Any |
Any |
|
9 |
Any |
Any |
1 |
Transverse or Oblique |
Any |
Any |
|
10 |
Any |
Any |
1 |
Cephalic |
< 37 |
Any |
NB ( you will receive a program that can automatically calculate the Robson classification after this workshop ) This table should be filled on cases by case basis by the attending resident or specialist of the hospital then robson group assigned and verified either manually or electronically.
Examples of women classification in Robson groups (Table 5 ) (Can be done as exercise to practice)
Table 5
|
Parity senarios |
Robson Group and Explanation |
|
Emergency cs for full term nullipara cephalic single due to fatal distress |
Robson 1 |
|
G5P4 28 weeks vaginal delivery |
10 |
|
G4P0+3 spontaneous labor 38 weeks single cephalic |
1 |
|
G2P1 with previous myomectomy ,for elective CS 38 weeks single cephalic |
2 ( only if previous scar uterus due to cs should we consider class 5 ) |
|
Onset of labour senarios |
|
|
G1P0 39 weeks single cephalic presentation in labour (3 contractions /10 min and rupture memberanes ) |
1 |
|
The same previous case ( monitor after 4 hours showed no progress of cervical dilatation so oxytocin was infused for augmentation of labor .will this change the group |
NO still it is group 1 |
|
G3P2 gestional DM planned for elective cs on 39 weeks .came on spontaneous labour 38 weeks cephalic single |
Group 3 (actual status is spontaneous and the classification always considers howlabourstartedin thecurrent pregnancy, regardless of how delivery wasplanned. |
|
G4P3 full term single cephalic .planned foe elective cs due to marked oligohydramnios |
2 |
|
Multiple pregnancy senarios |
|
|
G2P1 twin first breech |
8 ( All women with multiple pregnancies regardless of the first baby presentation ) |
|
G1P0 twin pregnancy at 8 weeks then vanishing twin and at at 39 weeks in spontaneous labour, the live fetus is in cephalic presentation |
1 ( the current situation is single pregnancy ) |
|
A 42 year old multipara (2 previous CS) was diagnosed by ultrasound with a twin pregnancy at 10 weeks. At 31 weeks, she is admitted because of severe preeclampsia and fetal growth restriction, with both fetuses alive. On the second day, one of the fetuses dies. She is immediately taken to the labour ward for a pre-labour CS. The presenting fetus is breech and dead.The surviving fetus is cephalic. How should I classify this woman: in Group 5.2, Group 7 or Group 8? |
8 as twin ( the death of one twin occur after medico legal viability age ) |
|
Presentation senarios |
|
|
G4P3 in spontaneous labour at 39 weeks, 5 cm dilated, with ruptured membranes, and a singleton fetus in cephalic presentation with a hand alongside the head. Should I classify her in Group 3 or in Group 9? |
This woman should be in Group 3. As long as the presenting part is the fetal head, this is considered a cephalic presentation. Group 9 is only for women in transverse or oblique lie possible with a prolapsed arm which is not the case here. |
|
G1P0 in spontaneous labour at 38 weeks, 8 cm dilated, with a face presentation? |
This woman belongs in Group 1. All face, brow or compound cephalic presentations should be categorized in Group 1. As long as the presenting part is the fetal head, this is considered a cephalic presentation. |
|
Fetal age and malformation |
|
|
G1P0 32 weeks, fully dilated, with a live singleton cephalic fetus and umbilical cord prolapse. Should this woman be classified in Group 1, 10 or Group 9? |
Group 10 because it includes all preterm singleton, cephalic pregnancies. Group 1 is not for her because her pregnancy is not at term (37 weeks or more) and Group 9 is only for transverse or oblique lies, which is not her case. |
|
G3P2 previous 2 CS 30 weeks, with severe pre- eclampsia, not in labour, with a dead fetus in breech presentation. Should this woman be included in the Robson Classification at all since her fetus is dead? If we classify her, does she belong in Group 5, Group 7 or Group 10? |
The Robson Classification does not exclude stillbirths; therefore, this woman should be included in the classification. She belongs in Group 7 because it includes “All multiparous women with a single breech including those with previous CS”. She does not belong in Group 5 or Group 10 because the fetus is breech and these groups only include cephalic presentations. |
|
G3P2 with an anencephalic fetus is admitted at 28 weeks for induction. The fetus is dead and in a cephalic presentation. Should we classify her at all in the Robson Classification? If we classify her, should she be categorized in Group 2 or Group 10? |
The Robson Classification does not exclude malformed or dead fetuses; therefore, this woman should be included in the classification. She belongs in Group 10, which includes all women with a single cephalic preterm fetus; the fact that the fetal head has a malformation does not change the fact that the presentation is still cephalic. Group 2 is for term, cephalic presentation, which is not the case here. |
- The Robson Classification Report Table
In order to make the most of the information provided by the Robson Classification in local settings and to allow comparisons between settings, the data is best reported in a standardized way (the “Robson Classification Report Table”)
Table 6 : The Robson Classification Report Table
|
Setting name: Hospital ABC |
period: |
|||||
|
Colum n 1 |
Column 2 |
Column 3 |
Column 4 |
Column 5 |
Column 6 |
Column 7 |
|
Group |
Numbe rof CSin group |
Number of women in group |
Grou p Size1 (%) |
Grou p CS rate2 (%) |
Absolute group contributio n to overall CS rate3 (%) |
Relative contributio n of group to overall CS rate4 (%) |
|
1 |
|
|
|
|
|
|
|
2 |
|
|
|
|
|
|
|
3 |
|
|
|
|
|
|
|
4 |
|
|
|
|
|
|
|
5 |
|
|
|
|
|
|
|
6 |
|
|
|
|
|
|
|
7 |
|
|
|
|
|
|
|
8 |
|
|
|
|
|
|
|
9 |
|
|
|
|
|
|
|
10 |
|
|
|
|
|
|
|
Total* |
Total |
Total |
100% |
Overall |
Overall CS |
100% |
|
|
number CS |
number |
|
CS rate |
rate |
|
|
|
|
women |
|
|
|
|
|
|
|
delivere |
|
|
|
|
|
|
|
d |
|
|
|
|
1.Group size (%) = n of women in the group / total N women delivered in the hospital x 100
2. Group CS rate (%) = n of CS in the group / total N of women in the group x 100
3. Absolute contribution (%) = n of CS in the group/ total N of womendelivered in the hospital x 100
4. Relative contribution (%) = n of CS in the group / total N of CS in the hospital x 100
Interpretation of the Robson Classification Report Table
Benefits of interrelation
Useful insights into the quality of data collection
- the type of population served by the hospital
- the CS rates of each group
- how each of the individual 10 groups contributes to the overall rate of CS in your setting
- The overall philosophy of care of in a maternity unit.
- Can guide the necessary training and advocacy at each units as well as country level for decreasing cs rate.
- can be used to analyze changes over time
- compare differences between hospitals and to help modify clinical practice to optimize CS rates in specificgroupswhileensuringgood maternalandperinataloutcomes.
GENERAL PRINCIPLES and tips of Interpretation of Robson Report Tables
- In settings with low volumes of delivery, the interpretation should take into account the effect of small changes in numbers on the percentages.
- It is important to assess the sizes of all the 10 groups to ascertain the balance and makeup of the whole obstetric population so it should be clear that No individual group should be interpreted unless the whole 10 groups are analysed first.
- The main three reasons for differences in sizes of groups or events and outcomes within groups are the following:
1- Poor data quality (incorrect information in the patient records or errors in retrieving information from the records)
2- Differences in significant epidemiological characteristics of the populations (age, BMI, etc...)
3- Differences in clinical practice. Only consider differences in practice after you have evaluated quality and epidemiological variables.
Steps of intepretatin the Robson Classification Report Table Three major steps
1) Assessment of data quality
2) Assessment of type of obstetrics population
3) Assessment of CS rate
Table 7 : Steps to assess quality of data using the Robson Classification Report Table
|
Step |
Interpretation by Robson |
Example: MCS population** |
Further Interpretation |
|
Lookatthe total numbersof CS andof women deliveredin your hospital |
These numbers should be identicaltothetotal numberof CSandof womendeliveredin your hospital. |
NA |
Ifthesenumbersdonot match,thendatais missing or incorrect. Some women may not have been classified in the Robson groups because of missing variables or were incorrectly classified as to type of delivery. |
|
2. Look at the size of Group 9 (Column 4) |
It should be less than 1%. |
0.4% |
If this is > 1%, it is probable that women with breech (or other) presentations have been misclassified as transverse /oblique lie and allocated to this group. As the classification includes all women who have delivered, if any one group is smaller or bigger, look to the other groups which sometimeswillshowwhere the manifestation is. |
|
3.Lookat theCSrate ofGroup9 (Column 5): |
Itshouldbe 100% by convention. |
88.6% |
By convention,if the woman gives birth vaginally by internal version,itshouldbeclassifyas either cephalicorbreech. CS rateinGroup9should be 100% |
Table 8 : Steps to assess type of population using the Robson Classification Report Table
|
Step |
Robson guideline |
Example: MCS population |
Further Interpretation |
|
. Look at thesizeof Groups1+ Group 2 (Column 4)- |
Thisusually represents35-42% of obstetric population of most hospitals. |
38.1% |
Insettingswithhighproportionof womenwhohave onlyonechildrather thanmorethanonechild,the groupof nulliparouswomeni.e.Groups1and2 tendsto belarger.Insettingswherethe oppositeistrue,thesize ofGroups1+ Group2willbesmallersincemostofthe populationwillberepresentedby multiparouswomen |
|
Look at the size of Groups3+ 4(Column 4)- |
This usually represents about 30% of women |
46.5% |
Insettingswithhighproportionofwomen withmore thanonechildratherthanonly onechild,thesizeof Groups 3 + Group 4 will be higher than 30% (provided theyhavedeliveredvaginally).Another reasonforalowsizeofGroups3and4 couldbethat thesizeofGroup5isvery highwhichwouldbe accompanied byaveryhighoverallCSrate. |
|
Look at the size of Group 5 (Column 4) |
Itisrelatedtothe overallCSrate. The size of Group 5 is roughly usually abouthalfofthetotal CS rate.Insettings withlowoverallCS rates,itisusually under10%. |
7.2% |
ThesizeofGroup5isusuallyrelatedto theoverallCS rate.Ifthesizeofthis groupislarger,itmeansthat therehas beenahighCSrateinthepastyearsin that hospitalandmainlyinGroups1and 2.Inplaceswith highCSrates,thesizeof thisgroupcouldbe>15%. |
|
Look at thesizeof Groups6+7(Column4) |
It should be 3- 4% |
2.7% |
Ifthetotal ismuch over 4%, the most commonreason isusuallya highrateof pretermdeliveriesorahigher proportion of nulliparous women. Therefore look at sizeofGroup10(Column4).Ifthatisover 4-5%,this hypothesis could be true. |
|
. Look at the size of Groups 8 (Column 4)- |
It should be 1.5 - 2% |
0.9% |
Ifitishigher,thehospitalisprobably tertiary(high risk,referral)orrunsa fertilizationprogram.If lower, probably a lot of the twins are referred |
|
|
|
|
out especially if the remaining twins have a low caesarean section rate |
|
Look at the size of Groups 10 (Column 4)- |
Itshouldbeless than5%in most normalrisk settings. |
4.2% |
Ifitishigher,thehospitalisprobably tertiary(high risk,referral)orthereisa highriskofpreterm birthsinthe populationthatthehospitalserves.If, inaddition, the CSrate is low inthis group, it could represent a preponderance of spontaneous pretermlabour. If the CS rate inthis group is high, itcouldsuggestmore providerinitiatedpre-labour CSfor fetalgrowthrestrictionorpre- eclampsia andotherpregnancyor medicalcomplications. |
|
Lookat the Ratio of the size of Group1 versusGroup2 (Divide the size of Group 1 bythesize of Group 2, Column 4) |
It is usually 2:1 or higher |
Ratio 3.3 |
Ifitislower,suspectpoordata quality:nulliparous women who received oxytocin for augmentation (acceleration) oflabour(andshould be in Group 1) mayhavebeen misclassifiedas“induction”(and incorrectly classified as Group 2). Ifdatacollectionis correct, alower ratio may indicatethatyou havea highinduction/prelabour CS issue which may indicate a high risk populationinnulliparouswomen andarelikely therefore to have a high CS rate. Additional informationonpre-labourstillbirths wouldbethe next question to ask. Onthecontrary,iftheratioisvery high,youmay wanttolook atyourpre- labour stillbirth ratein this population whichmayindicatethatyouarenot inducing enough. Or alternatively you may have a very low risk population |
|
Lookat the Ratio of the size of Group3 versus Group 4. |
It is always higher than the ratio of |
Ratio 6.3 |
Ifitislower,suspectpoordata quality:multiparous women who |
|
(Divide thesizeof Group3 bythesizeof Group 4, Column 4): |
Group 1/Group 2 in the same institution, i.e, largerthan2:1. This is very reliable finding in confirming data quality and culture of the organization. |
|
received oxytocin for “augmentation” oflabour(and shouldbeinGroup3)mayhave been misclassified as “induction” (and incorrectly classified as Group 4). Alowratio(duetolargeGroup4b) maysuggesta poor previous maternal experience in vaginal delivery and a request for pre- labour CS in multiparouswomen. Another explanation may be pre- labour CS done to perform tubal ligation (common in settings where family planning is not easily available). |
|
.Lookat the Ratio ofthesize of Group6 versus Group 7. (Divide thesizeofGroup6 bythesize of Group 7, Column 4) |
It is usually a 2:1 because breeches are more frequent in nulliparous women than in multiparous women. |
Ratio 0.8 |
Iftheratioisdifferent,suspecteither unusual nullipara/multipararatio or inaccurate data collection |
Table 9: Steps to assess caesarean section rates using the Robson Report Table
|
Step |
Robson guideline |
MCS reference population |
Further Interpretation |
|
Look at the CS rate for Group 1 (Column 5) |
Ratesunder10%are achievable |
9.8% |
This rate can only be interpreted accurately when you have considered the ratio of the sizes ofGroups1and2.Inprinciple,thehigherthe ratio of size of Groups 1:2, the higher the likelihoodofboththeCSrateinGroup1and2 being individually higher. However, the overall CSrateinGroups1and2combinedmaystillbe low or the same. |
|
Lookatthe CS rate forGroup2 (Column 5): |
Consistentlyaround 20-35% |
39.9% |
CSratesinGroup2reflectthesizeandratesin 2aand2b.IfsizeofGroup2bislarge,theoverall CSratesinGroup2isalsogoingtobelarge.If Group2bisrelativelysmall,thenhighratesof CSinGroup2mayindicatepoorsuccessrates for induction or poor choice of women to induce andconsequentlyahighrateofCSinGroup2a. Remember the general principle of not interpreting one single subgroup on its own without knowing what is left out. The interpretationof group 2arequires knowingthe relative sizes of Groups 1 and 2b. |
|
Lookatthe CS rate for Group3 (Column 5) |
Normally, no higher than 3.0%. |
3% |
InunitswithhigherCSratesinthisgroup,this may be due to poor data collection. It is possible thatwomenwithpreviousscars(Group5) were incorrectly classified as Group 3. Other possible reasons for high rates could be for exampleto do tubal ligation in settings with poor access to contraception, or maternal request. |
|
Look at the CS ratefor Group 4 (Column 5) |
Itrarelyshouldbehigher than 15% |
23.7% |
CS rates in Group 4 reflect the size and rates in 4aand4b.Ifsizeof Group4bis large,theoverall CSrates inGroup 4is alsogoingto behigh.If Group 4b is relatively small, then high rates of CS in Group 4 may indicate poor success rates for induction or poor choice of women to induce and consequently a high rate of CSin Group 4a. Poor data collection could also be a reason for high CSrates inGroup 4; forexample dueto inclusion of women with previous scars in this group (when they |
|
|
|
|
should bein Group 5). Lastly, ahigh CS rate in Group 4 may reflect ahigh maternal request for CS even if these women havedeliveredtheir first pregnancy vaginally. This may be because of a previously traumatic or prolongedlabour ortodotuballigationin settings withpooraccesstocontraception. |
|
Lookatthe CS rate forGroup5 (Column 5) |
Rates of 50-60% are considered appropriate provided you have good maternal and perinatal outcome. |
74.4% |
Ifratesarehigher,thisispossiblyduetoalarge Group5.2(womenwith2ormoreprevious CS). Thiscouldalsobeduetoapolicyof scheduling pre-labour CS for all women with 1 previous scar without attempting a trial of labour. |
|
Lookat the CS rate for Group8 (Column 5) |
It is usually around 60%. |
57.7% |
Variations will depend on the type of twin pregnancy and the ratio of nulliparous/multiparouswithorwithouta previous scar. |
|
Lookatthe CS rateinGroup10 (Column 5): |
Inmost populations it isusually around 30% |
25.1% |
Ifhigherthan30%,itisusuallyduetomany casesof high risk pregnancies (e.g.fetalgrowth restriction,preeclampsia)thatwillneedpreterm pre-labourCS.Iflowerthan30%,itsuggestsa relatively higher rate of preterm spontaneous labour andhencealoweroverallCSrate. |
|
Look at the relative contributionof Groups1,2and5 totheoverallCS rate(addthe contribution of each of these groups in Column 7) |
These three groups combined normally contribute to 2/3 (66%)ofallCS performedin most hospitals. |
These three groups combined contributed to 63.7%ofallCS |
Thesethreegroupsshouldbethefocusof attentionifthehospitalistryingtolowerthe overall CS rate. The higher the overall CS rate, thegreaterthefocusshouldbeinGroup1. |
|
Look at the absolute contributionof Group5tothe overall CSrate (Column 7) |
|
Thisgroupwas responsible for 28.9% ofall CS |
If it is very high, this may indicate that in previous years,CSratesinGroups1and2have beenhigh and it is worth exploring further. |
Table 10 Challenges in implementing Robson Classification system and how to overcome
|
Challenge |
Way to overcome |
|
Lack of awareness by this classification system among obstercian and its importance |
Training and awareness campaign |
|
Lack of training of physician |
Training workshop as this one (TOT and ordinary workshops) |
|
Need of dedicated staff for collecting data |
designate a person if possible (clinician, nurse, clerk, manager or other) to be in charge of organizing data collection and producing the Robson Report Tables at weekly or monthly intervals |
|
Lack of definition or consensus on the core variables used in the classification |
We therefore recommend that each hospital creates a clear written definition (a glossary) of the variables that may vary in different settings will provide here the international standard accepted in Egypt . |
|
Quality of the data |
Ensuring good quality of the data should not be taken for granted and it can be challenging even in high- resource settings. |
|
Misclassification of women in wrong groups |
Data review Electronic format ( available here also) |
|
Cases that cannot be classified due to missing data: |
The size of “Unclassifiable” categoryisanimportantindicatorofthe quality of the data in the individual patientrecords. |
|
The lack of validation of the interpretation rules |
encourageusersoftheclassification to collect theirown data on maternal aswellasperinatalmorbidityand mortality per Robson group and analyze these data regularly |
- References
1- Betran AP, Torloni MR, Zhang JJ, et al. WHO statement on caesarean section rates. BJOG 2016;123:667–70.
2- 2 Bailey PE, Paxton A. Program note. Using UN process indicators to assess needs in emergency obstetric services. Int J Gynaecol Obstet 2002;76:299–305.
3- 3 Thomas S, Meadows J, McQueen KAK. Access to cesarean section will reduce maternal mortality in low- income countries: a mathematical model. World J Surg 2016;40:1537–41.
4- Allen VM, O'Connell CM, Farrell SA, et al. Economic implications of method of delivery. Am J Obstet Gynecol 2005;193:192–7
5- Betrán AP, Ye J, Moller A- B, et al. The increasing trend in caesarean section rates: global, regional and national estimates: 1990–2014. PLoS One 2016;11:e0148343
6- Betrán AP, Ye J, Moller A-B, Zhang J, Gülmezoglu AM, Torloni MR. The increasing trend in caesarean section rates: global, regional and National Estimates: 1990-2014. PLoS One. 2016;11(2):e0148343.
7- Egypt Demographic Health Survey,2014https://dhsprogram.com/pubs/pdf/FR302/FR302.pdf
8- Al Rifai RH. Trend of caesarean deliveries in Egypt and its associated factors: evidence from national surveys, 2005–2014. BMC pregnancy and childbirth. 2017;17(1):417.
9- Gerard H A Visser, Diogo Ayres-de-Campos, Eytan R Barnea, Luc de Bernis, Gian Carlo Di Renzo, Maria Fernanda Escobar Vidarte, Isabel Lloyd, Anwar H Nassar, Wanda Nicholson, P K Shah, William Stones, Luming Sun, Gerhard B Theron, Salimah Walani.FIGO position paper: how to stop the caesarean section epidemic.the lancet . Volume 392, ISSUE 10155, P1286-1287
10- Appropriate technology for birth. Lancet. 1985;2(8452):436–7. doi: 10.1016/S01406736(85)92750-3.
11- WHO statement on caesarean section rates. Geneva: World Health Organization; 2015 (WHO/RHR/15.02;
http://www.who.int/reproductivehealth/publications/ maternal_perinatal_health/cs-statement, accessed 31 May 2018).
12- BetránAP, TorloniMR, Zhang J, GülmezogluAM, for the WHO Working Group on Caesarean Section. Commentary: WHO Statement oncaesareansectionrates. BJOG. 2016;123(5):66770
13- 9. Robson MS. Classification of caesarean sections. Fetal and Maternal Medicine Review.2001;12(1):23-39.
14- 10. TorloniMR, BetranAP, Souza JP, WidmerM, Allen T, GulmezogluM, et al. Classifications forcesareansection: a systematic review. PLoSONE. 2011;6(1):e14566
15- Ioannis Mylonas, Klaus Friese. Indications for and Risks of Elective Cesarean Section Deutsches Ärzteblatt International | Dtsch Arztebl Int 2015; 112: 489–9
16- NICE guideline on CS
17- American College of O, Gynecologists: ACOG Committee Opinion No. 386 November 2007: cesarean delivery on maternal request. Obstet Gynecol 2007; 110: 1209–12.
18- Coleman VH, Lawrence H, Schulkin J: Rising cesarean delivery rates: the impact of cesarean delivery on maternal request. Obstet Gynecol Surv 2009; 64: 115–9.
19- Wiklund I: New guidelines for cesarean section on maternal r equest. Sex Reprod Healthc 2012; 3: 97.
20- Sahlin M, Carlander-Klint AK, Hildingsson I, Wiklund I: First-time mothers’ wish for a planned caesarean section: deeply rooted emotions. Midwifery 2013; 29: 447–52.
21- ACOG committee opinion on CS on maternal request 2013 .
22- Franz MB, Husslein PW: Obstetrical management of the older gravida. Womens Health (Lond Engl) 2010; 6: 463–8.
23- Zaki MN, Hibbard JU, Kominiarek MA: Contemporary labor patterns and maternal age. Obstet Gynecol 2013; 122: 1018–24.
24- Pandey S, Shetty A, Hamilton M, Bhattacharya S, Maheshwari A: Obstetric and perinatal outcomes in singleton pregnancies resulting from IVF/ICSI: a systematic review and meta-analysis. Hum Reprod Update 2012; 18: 485–503.
25- Gillet E, Martens E, Martens G, Cammu H: Prelabour caesarean section following IVF/ICSI in older-term nulliparous women: too precious to push? J Pregnancy 2011; 2011: 362518.
26- Hannah ME, Hannah WJ, Hewson SA, Hodnett ED, Saigal S, Willan AR: Planned caesarean section versus planned vaginal birth for breech presentation at term: a randomised multicentre trial. Term Breech Trial Collaborative Group. Lancet 2000; 356: 1375–83.
27- . TorloniMR, BetranAP, Souza JP, WidmerM, Allen T, GulmezogluM, et al. Classifications forcesareansection: a systematic review. PLoSONE. 2011;6(1):e14566.
28- Robson MS. Classification of caesarean sections. Fetal and Maternal Medicine Review.2001;12(1):23-39.
29- Who Robson implementation manual
30- Managing complication in pregnancy and childbirth: a guide for midwives and doctors. Geneva, World Health Organization, 2000
31- WHO RECOMMENDATION OF Induction of Labour
32- Robson M, HartiganL, Murphy M. Methods of achieving and maintaining an appropriate caesarean section rate. Best PractResClinObstetGynaecol. 2013;27:297-308
33- Robson MS. Can we reduce the caesarean section rate? Best PractRes ClinObstetGynaecol. 2001;15(1):179-94.
34- Souza JP, BetránAP, Dumont A, de MuncioB, Gibbs Pickens C, Deneux- TharauxC, et al. A global reference for caesarean section rates (C-Model): a multicountrycross-sectional study. BJOG 2016;123:427–436
35- Souza JP, GülmezogluAM, VogelJ, CarroliG, LumbiganonP, Qureshi Z, et al. Movingbeyondessentialinterventionsforreductionof maternal mortality(theWHO MulticountrySurveyonMaternal and Newborn Health): a cross-sectionalstudy. Lancet. 2013;18(38):1747-55.